

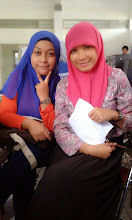


This is the 16th meeting of advanced English engineering.This is the longest meeting because the last meeting. Learning starts around 12.00 – 02.00 pm. At this class Endah and Feby sit in second bench They look concern Mr.Aji explanation, Mr. Aji asks to continue the presentation from a week ago. There are 8th groups who perform in front of the class.First group are Afina and Rofiatus, second group are Endah and Feby , 3th group are Ninik and Rozin, 4th group are Ikfar and Laksamana,. 5th group are Puguh and Robby ,6th group are Rizka and Faqih, 7th group are Khoirul and Esty, 8th group are Agus and Fuqaha. Mr. Aji chooses the different moderator and secretary are every group..
Today endah and feby perform a presentation, Wildan as moderatorar, open the presentation and first presentation by endah about title “DISCUSS BEHAVIOUR USING SOCIAL MEDIA FOR STUDENTS OF INFORMATICS ENGINEERING EDUCATION STATE UNIVERSITY OF MALANG”

Endah said “Main menu have 4 chapter, chapter 1 introduction, chapter 2 metodology,chapter 3 result and discussion, chapter 4 conclusion and recommendation”

Endah said “There are 3 point in chapter 1 introduction, background information are — Social media has many benefits to everyone — Education and social media have a relationship — Social media can be used to online discussing, share subject matter, and simplify to communicate between students and teacher or lecturer
And then problem :
How is discuss Behaviour using social media for students of informatics engineering education, state university of malang ?
And the last in chapter 1 is objective :
This research is used to explore Discuss Behaviour Using Social Media For Students Of Informatics Engineering Education, State University Of Malang”

Endah said “And then chapter two, there are seeting and respondents, instrument, data collection, and data analysis, ok about setting and respondents :
The research has done at Electrical Engineering Department, Faculty of Engineering, State University Of Malang, and bout respondents are 50 students of informatics engineering education , instrument in this research is using questionnaire , The researchers collect data from answering some written questions (and klik open questionnaire from this slide), an then data collection there are editing (The researchers correct the questionnaires, If data are incomplete then the research repair and repeat to collect data), coding (The researchers give code 0 and 1 to simplify analysing data) , entry data (The researchers entry data to microsoft excel)and cleaning data(The researchers check the final data) “

And next presenter by feby , feby explain about data analys .
Feby said “Analysis method that we used is descriptive analysis percentage. It is used to examine variables in this research, Descriptive Analysis Percentage is processed by dividing frequency with number of respondent and multiplied by 100%,Explanation :
P : Percentage
f : Frequency
N : Number of Respondents
100% : Fixed Number
The computation step of descriptive percentage is as follows :
1. Correcting the answer of questionnaire from respondents
2. Computing the answer frequency
3. Computing the number of respondents. It is 50 people
4. Entering data to the formula”

Feby continue this slide presentation about chapter 3 Result and discussion .Feby said “Based on descriptive analysis percentage we know the most answer for each question on questionnaire. There are five points that must be answered by respondents,
- Technology capability Based on that table, respondents that can use gadget is about 88% or 44 respondents, this is the most percentage and 84% respondent can use internet or 42 people, this is the lowest percentage.
- Social media that is often used Based on that table, respondents often use Facebook is about 88% or 44 respondents, this is the most percentage. 12% respondent often use Twitter or 6 respondents. 24% respondent often use Whatsapp or 12 respondents. 10% respondent often use Line or 5 respondents. 6% respondent often use the other sosial media or 3 respondents, this is the lowest percentage.
- Discussion preference Based on that table, respondents often use Facebook is about 88% or 44 respondents, this is the most percentage. 12% respondent often use Twitter or 6 respondents. 24% respondent often use Whatsapp or 12 respondents. 10% respondent often use Line or 5 respondents. 6% respondent often use the other sosial media or 3 respondents, this is the lowest percentage
- Preference about social media that is used to discuss
- Benefit from discussing via social media

Feby said about chapter 4 conclusion and recommendation

“And recommendation is Hopefully this research can be used as reference to the next research and student can get more benefit from using social media to discuss”
And the last session , moderator asks the audience about question ,question 1 from rozin and question 2 from Agus and then close that presentation. Makrifatus as secretary write and read some question, answered question and conclusion to audience.
After the last presentation end, Mr.Aji give some conclusion and suggestion to us about UAS.
OK .. byeee… Thank you Mr Aji for all about this semester, we are so happy and enjoy.
Feby Fadillah && Endah Septa Sintiya
Informatic Engineering Education
Electrical Department
State University Of Malang


